How the Group SEIS data were aggregated
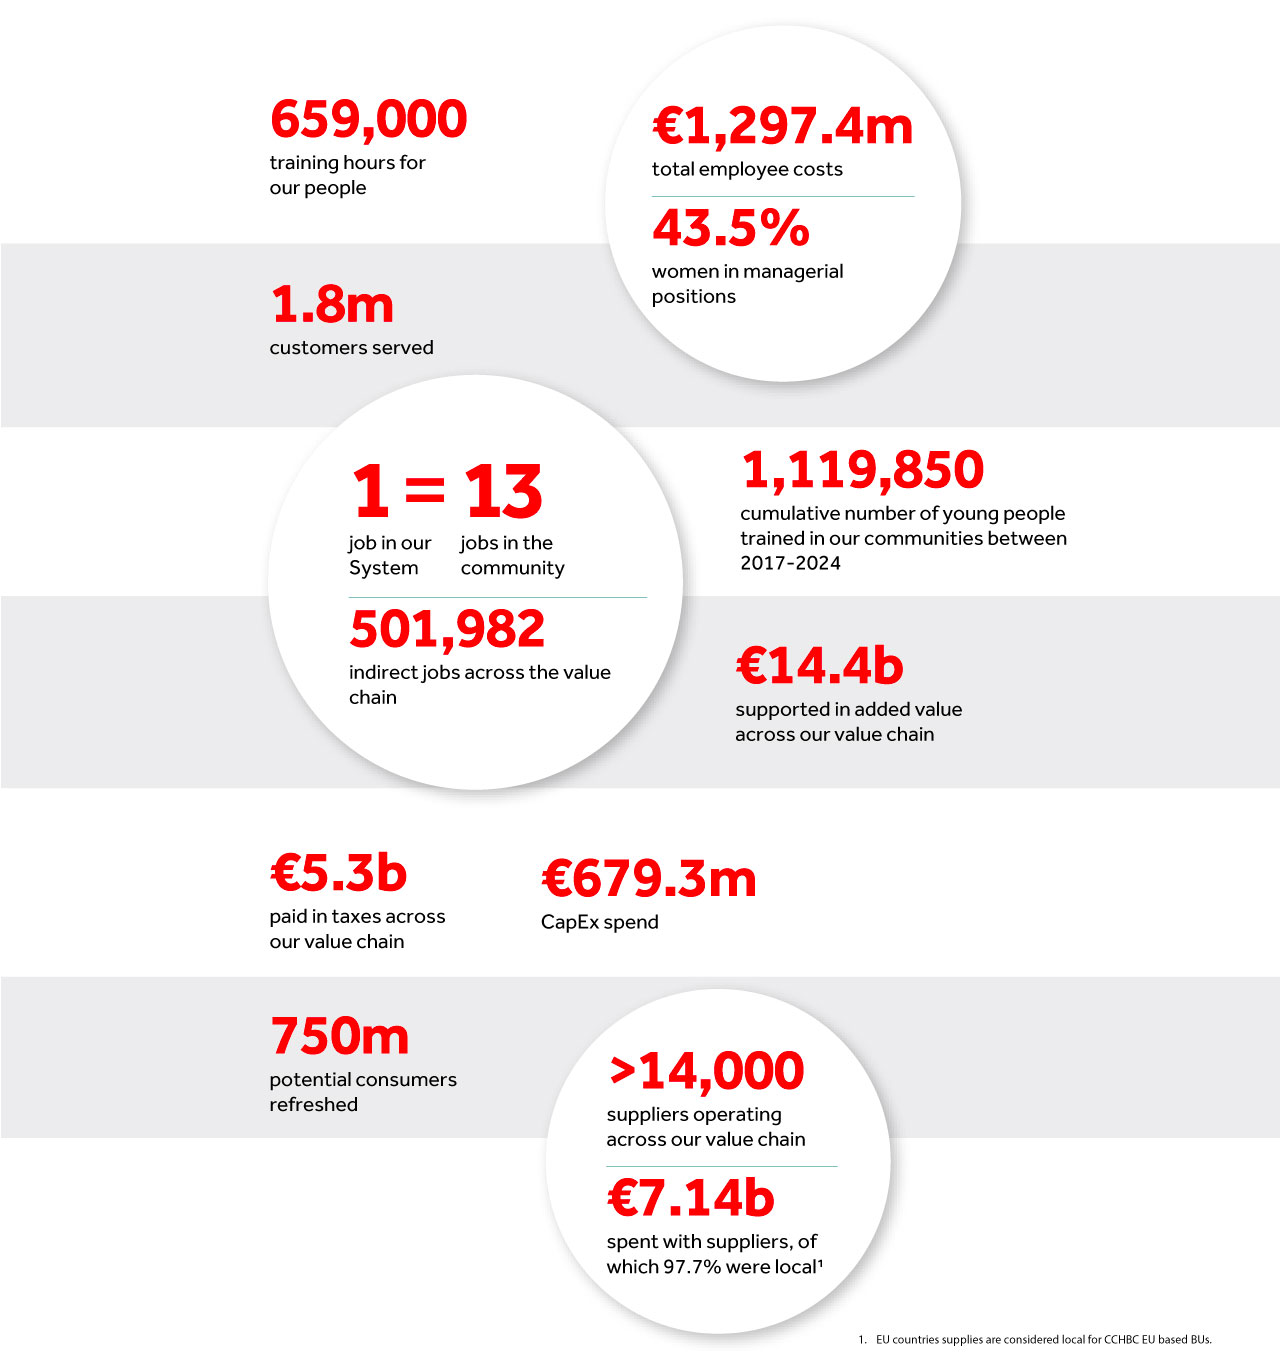
Based on the local SEIS reports from our markets, we performed an aggregation (i.e. simple addition). Furthermore, we included sustainability KPIs and the overall CCHBC footprint, data as reported in the 2024 IAR.
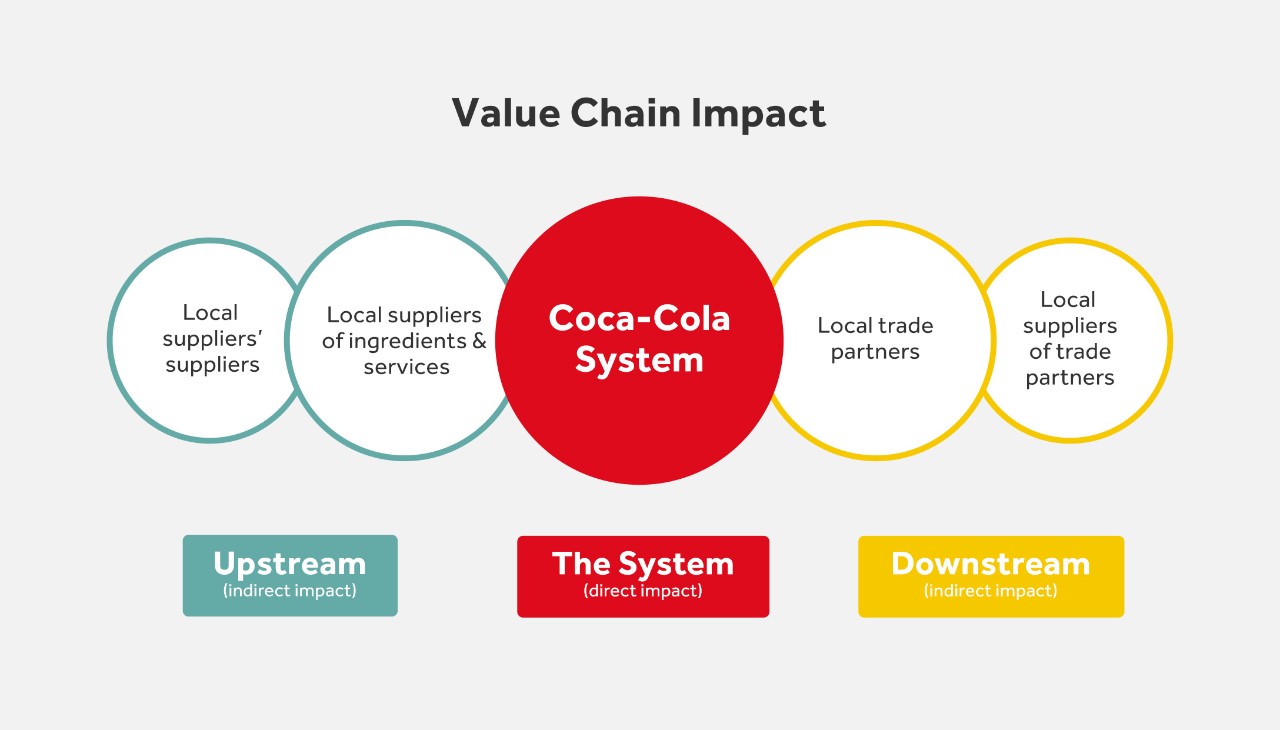
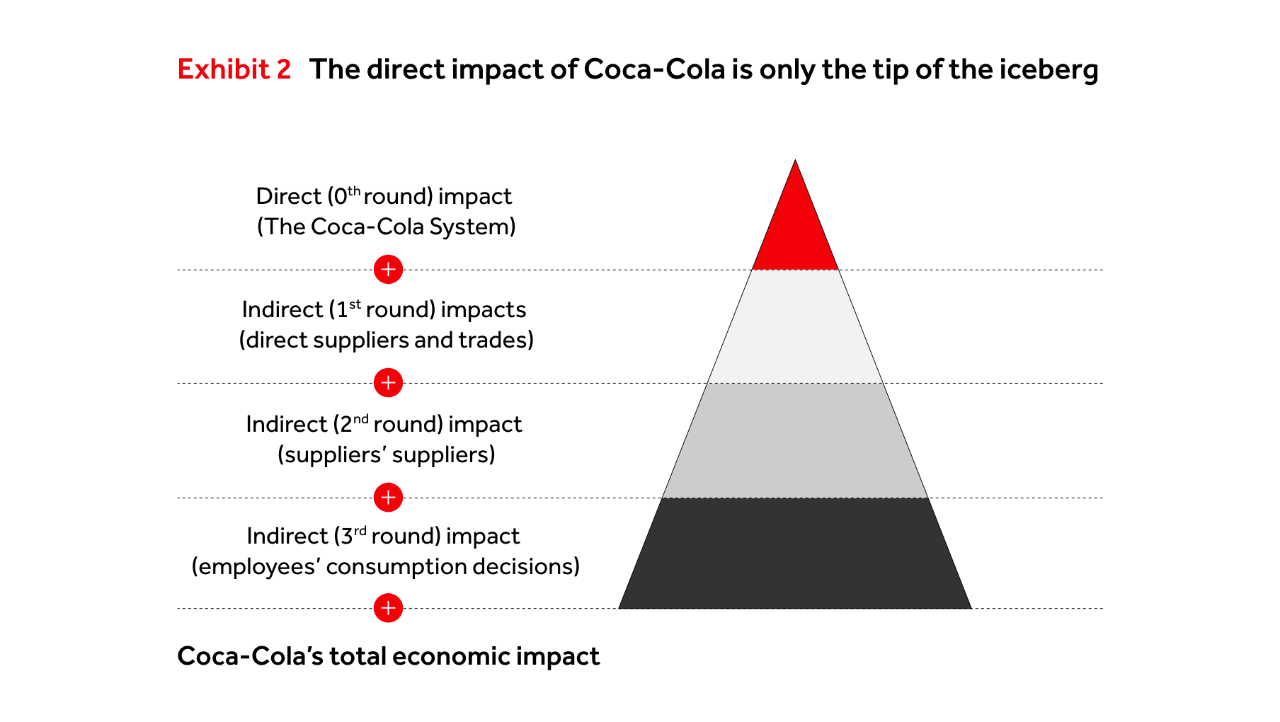
For the local SEIS reports, we utilise the input-output model, which follows the financials of the System as they flow through the economy, creating ripple effects across various sectors. The input data utilised are our financial data (revenues, expenses, taxes, sales volume and profits) as well as some further data from The Coca-Cola Company.
We do not conduct socio-economic studies for all of our markets every year; studies are conducted for each market on a rolling bases.
In 2024, we updated the studies for 18 markets, adding this information to the aggregate results from all socio-economic impact studies for the period 2018-2024.