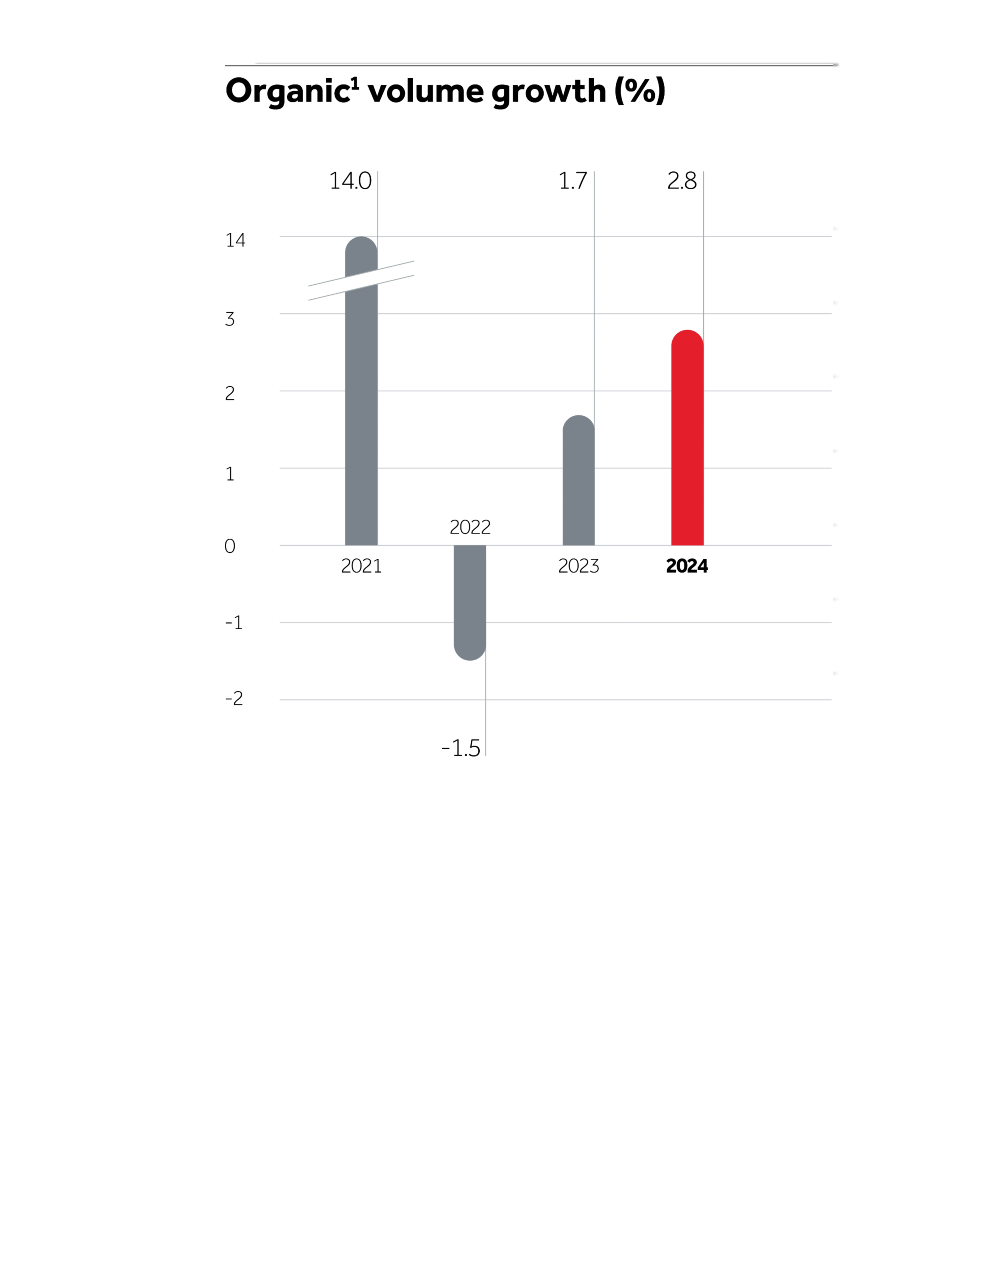
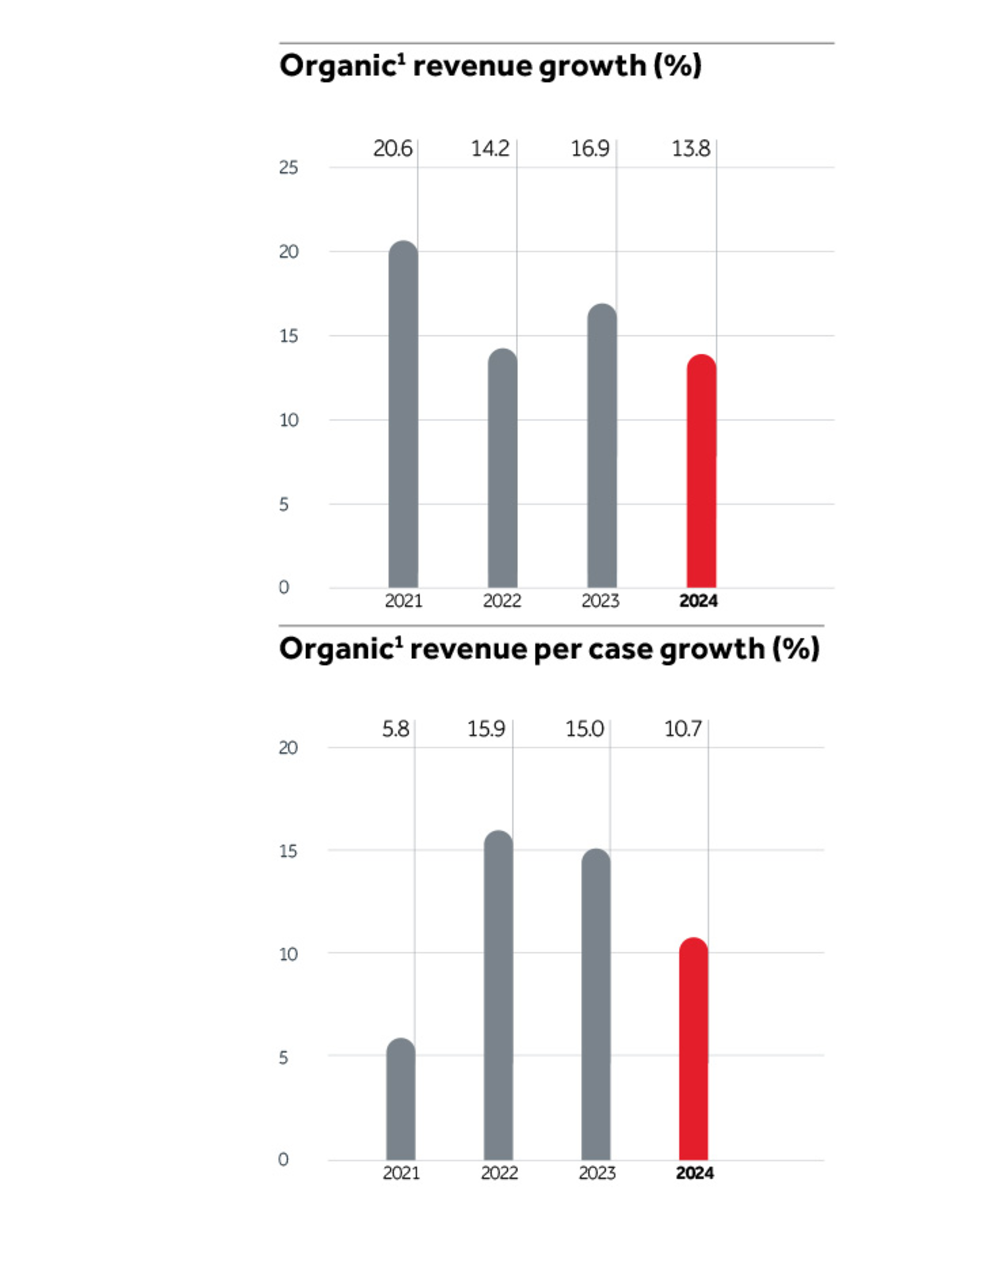
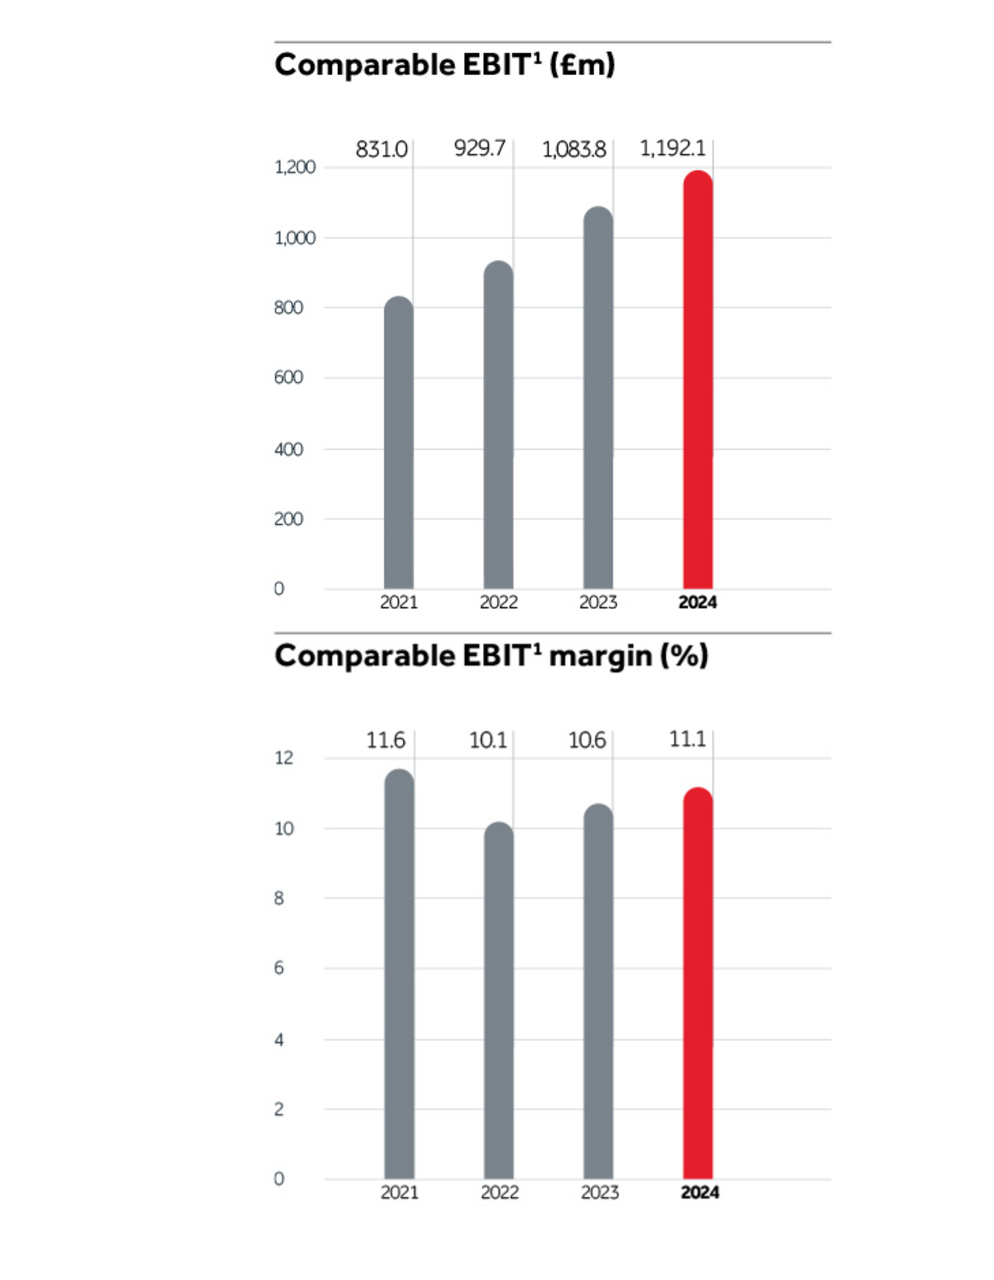
Downloadable Excel spreadsheet showing our financial data from 2008, to our most recent set of results.
Site Selector
Current Site: Group Website
- Phone: +414 483 59 111
- Email: webmaster@cchellenic.com
- Address: Coca-Cola HBC AG Turmstrasse 26 Zug 6300 Switzerland Zug 6300 Switzerland
- Phone: +374 105 41 028
- Email: reception.am@cchellenic.com
- Address: Coca-Cola HBC Armenia, Tbilisyan Highway Lane, 8/3 Building Yerevan, 0052, Armenia
- Phone: +431 610 60 0
- Email: cocacolaksco@cchellenic.com
- Address: Coca-Cola HBC Austria, Clemens-Holzmeister-Straße 6, Vienna, 1100, Austria
- Phone: +375 172 10 0210
- Address: Coca-Cola Beverages Belorussiya FE, Kolyadichi, Minsk District, 223010, Belarus
- Phone: +387 332 84 100
- Email: info.ba@cchellenic.com
- Address: Coca-Cola HBC B-H Sarajevo, Mostarsko raskrsce bb, Hadzici, 71240, Bosnia-Herzegovina
- Phone: +359 2 92 14 600
- Address: Coca-Cola HBC Bulgaria, Coca-Cola Business Center, 8 Racho Petkov Kazandzhiyata Str., Sofia, 1766, Bulgaria
- Phone: +385 124 80 222
- Email: info.hr@cchellenic.com
- Address: Coca-Cola HBC Croatia, Milana Sachsa 1, Zagreb, 1000, Croatia
- Phone: +357 228 85 000
- Email: infocy@cchellenic.com
- Address: Coca-Cola HBC Cyprus, 66 Kyriacos Matsis Ave., Nicosia, 2409 Engomi, Cyprus
- Phone: +420 283 01 5111
- Email: vnejsi-vztahy.cz@cchellenic.com
- Address: Coca-Cola HBC Czech Republic, Ceskobrodska 132 9, Praha, 198 21, Czech Republic
- Phone: +0224047111
- Email: egypt@cchellenic.com
- Address: 6th District, industrial zone, Nasr city, Cairo, Egypt
- Phone: +372 650 31 00
- Address: Coca-Cola HBC Estonia, A.H. Tammsaare tee 92, Tallinn 13423, Estonia
- Phone: +302 106 38 1700
- Email: infoline@cchellenic.com
- Address: Coca-Cola HBC Greece, 60 Kifissias ave, Athens, 151 25 Maroussi, Greece
- Phone: +36 24 500 500
- Address: Coca-Cola HBC Hungary, Nemedi ut 104, Dunaharaszti, H-2330, Hungary
- Phone: +353 188 07 100
- Email: ioi.communications@cchellenic.com
- Address: Coca-Cola HBC Ireland, Huntstown Business Park, Cappagh Road, Ballycoolin, Dublin 11, Ireland
- Phone: +390 227 07 71
- Email: relazioni.esterne@cchellenic.com
- Address: Coca-Cola HBC Italia, Piazza Indro Montanelli, 30, Sesto San Giovanni Milano, 20099, Italy
- Phone: +383 38 540 690
- Address: Km 5 ,rr. Prishtine- Shkup, Prishtine, 10000, Kosovo
- Phone: +371 671 09 999
- Email: dzerieni.pasutijumi@cchellenic.com
- Address: Coca-Cola HBC Latvia, Ulbrokas str. 40, Riga, 1021 Latvia
- Phone: +370 5219 9104
- Address: Coca-Cola HBC Lithuania, Spaudos str. 6-1, Vilnius, LT- 05132, Lithuania
- Phone: +234 127 06 670
- Email: info.nbc@cchellenic.com
- Address: Nigerian Bottling Company, Leventis Building, 3rd floor, Iddo House, Iddo PO Box 159, Lagos Nigeria
- Phone: +389 226 11 314
- Email: pivara.skopje@pivaraskopje.com.mk
- Address: Pivara Skopje, Str. 808, No. 12, Skopje, 1000, Republic of North Macedonia
- Phone: +482 251 95 100 / 101
- Email: infopl@cchellenic.com
- Address: Coca Cola HBC Poland, ul. Żwirki i Wigury 16, Warsaw 02-092, Poland
- Phone: +402 120 21 400
- Email: relatiiclienti@cchellenic.com
- Address: Coca-Cola HBC Romania, Global City Business Park, Building 2, 10, Bucuresti Nord Str., Voluntari, Ilfov, 077190 Romania
- Phone: +381 11 30 73 100
- Email: pr.rs@cchellenic.com
- Address: Coca-Cola HBC Serbia, 14-16, Batajnicki Drum str., Zemun, 11080, Serbia
- Phone: +386 158 90 400
- Email: infoslo@cchellenic.com
- Address: Brnčičeva ulica 41g, 1231 Ljubljana-Črnuče
- Phone: +41 (0) 44 835 91 11
- Email: coca.cola@cchellenic.com
- Address: Coca-Cola HBC Switzerland, Thurgauerstrasse 134, 8152 Opfikon, Switzerland
- Phone: +380 444 90 0707
- Email: ccbu@cchellenic.com
- Address: Coca-Cola Beverages Ukraine, 51st km of St. Petersburg, Highway Velyka Dymerka, Kyiv, 07 400, Ukraine
Market sites
Site Selector
Current Site: Group Website
- Phone: +414 483 59 111
- Email: webmaster@cchellenic.com
- Address: Coca-Cola HBC AG Turmstrasse 26 Zug 6300 Switzerland Zug 6300 Switzerland
- Phone: +374 105 41 028
- Email: reception.am@cchellenic.com
- Address: Coca-Cola HBC Armenia, Tbilisyan Highway Lane, 8/3 Building Yerevan, 0052, Armenia
- Phone: +431 610 60 0
- Email: cocacolaksco@cchellenic.com
- Address: Coca-Cola HBC Austria, Clemens-Holzmeister-Straße 6, Vienna, 1100, Austria
- Phone: +375 172 10 0210
- Address: Coca-Cola Beverages Belorussiya FE, Kolyadichi, Minsk District, 223010, Belarus
- Phone: +387 332 84 100
- Email: info.ba@cchellenic.com
- Address: Coca-Cola HBC B-H Sarajevo, Mostarsko raskrsce bb, Hadzici, 71240, Bosnia-Herzegovina
- Phone: +359 2 92 14 600
- Address: Coca-Cola HBC Bulgaria, Coca-Cola Business Center, 8 Racho Petkov Kazandzhiyata Str., Sofia, 1766, Bulgaria
- Phone: +385 124 80 222
- Email: info.hr@cchellenic.com
- Address: Coca-Cola HBC Croatia, Milana Sachsa 1, Zagreb, 1000, Croatia
- Phone: +357 228 85 000
- Email: infocy@cchellenic.com
- Address: Coca-Cola HBC Cyprus, 66 Kyriacos Matsis Ave., Nicosia, 2409 Engomi, Cyprus
- Phone: +420 283 01 5111
- Email: vnejsi-vztahy.cz@cchellenic.com
- Address: Coca-Cola HBC Czech Republic, Ceskobrodska 132 9, Praha, 198 21, Czech Republic
- Phone: +0224047111
- Email: egypt@cchellenic.com
- Address: 6th District, industrial zone, Nasr city, Cairo, Egypt
- Phone: +372 650 31 00
- Address: Coca-Cola HBC Estonia, A.H. Tammsaare tee 92, Tallinn 13423, Estonia
- Phone: +302 106 38 1700
- Email: infoline@cchellenic.com
- Address: Coca-Cola HBC Greece, 60 Kifissias ave, Athens, 151 25 Maroussi, Greece
- Phone: +36 24 500 500
- Address: Coca-Cola HBC Hungary, Nemedi ut 104, Dunaharaszti, H-2330, Hungary
- Phone: +353 188 07 100
- Email: ioi.communications@cchellenic.com
- Address: Coca-Cola HBC Ireland, Huntstown Business Park, Cappagh Road, Ballycoolin, Dublin 11, Ireland
- Phone: +390 227 07 71
- Email: relazioni.esterne@cchellenic.com
- Address: Coca-Cola HBC Italia, Piazza Indro Montanelli, 30, Sesto San Giovanni Milano, 20099, Italy
- Phone: +383 38 540 690
- Address: Km 5 ,rr. Prishtine- Shkup, Prishtine, 10000, Kosovo
- Phone: +371 671 09 999
- Email: dzerieni.pasutijumi@cchellenic.com
- Address: Coca-Cola HBC Latvia, Ulbrokas str. 40, Riga, 1021 Latvia
- Phone: +370 5219 9104
- Address: Coca-Cola HBC Lithuania, Spaudos str. 6-1, Vilnius, LT- 05132, Lithuania
- Phone: +234 127 06 670
- Email: info.nbc@cchellenic.com
- Address: Nigerian Bottling Company, Leventis Building, 3rd floor, Iddo House, Iddo PO Box 159, Lagos Nigeria
- Phone: +389 226 11 314
- Email: pivara.skopje@pivaraskopje.com.mk
- Address: Pivara Skopje, Str. 808, No. 12, Skopje, 1000, Republic of North Macedonia
- Phone: +482 251 95 100 / 101
- Email: infopl@cchellenic.com
- Address: Coca Cola HBC Poland, ul. Żwirki i Wigury 16, Warsaw 02-092, Poland
- Phone: +402 120 21 400
- Email: relatiiclienti@cchellenic.com
- Address: Coca-Cola HBC Romania, Global City Business Park, Building 2, 10, Bucuresti Nord Str., Voluntari, Ilfov, 077190 Romania
- Phone: +381 11 30 73 100
- Email: pr.rs@cchellenic.com
- Address: Coca-Cola HBC Serbia, 14-16, Batajnicki Drum str., Zemun, 11080, Serbia
- Phone: +386 158 90 400
- Email: infoslo@cchellenic.com
- Address: Brnčičeva ulica 41g, 1231 Ljubljana-Črnuče
- Phone: +41 (0) 44 835 91 11
- Email: coca.cola@cchellenic.com
- Address: Coca-Cola HBC Switzerland, Thurgauerstrasse 134, 8152 Opfikon, Switzerland
- Phone: +380 444 90 0707
- Email: ccbu@cchellenic.com
- Address: Coca-Cola Beverages Ukraine, 51st km of St. Petersburg, Highway Velyka Dymerka, Kyiv, 07 400, Ukraine


