Environmental impacts
We used nature change impact drivers, as outlined by the Taskforce on Nature-related Financial Disclosures (TNFD), to pinpoint a relevant universe of impact levels based on a widely accepted impact taxonomy. We formulated specific quantitative criteria, using scientific resources and reports including: the WWF Biodiversity Risk Filter, the WWF Water Risk Filter and the Science Based Targets Network for Nature (SBTN) Unified Water Availability Dataset; relevant legislative frameworks; established standards and guidelines, and compliance management systems; and various ISO audit documents.
People impacts
To address social and socio-economic impacts using a widely recognised impact taxonomy, we incorporated the United Nations Environment Programme (UNEP) Impact Radar. Our approach employs general qualitative criteria, encompassing findings from: legal reviews; compliance
management systems; the GRI Content Index; the UN Global Compact Communication on Progress reports; and a range of internal reports.
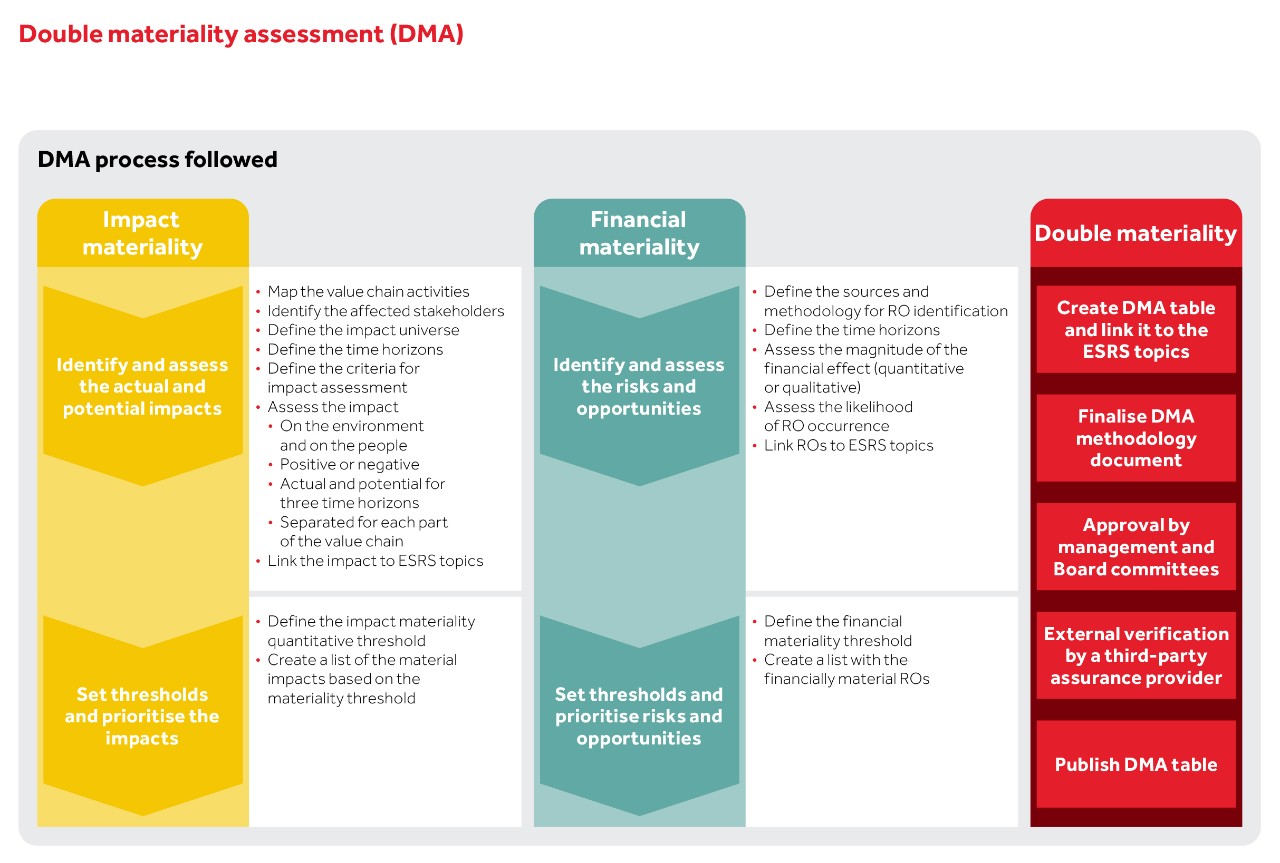
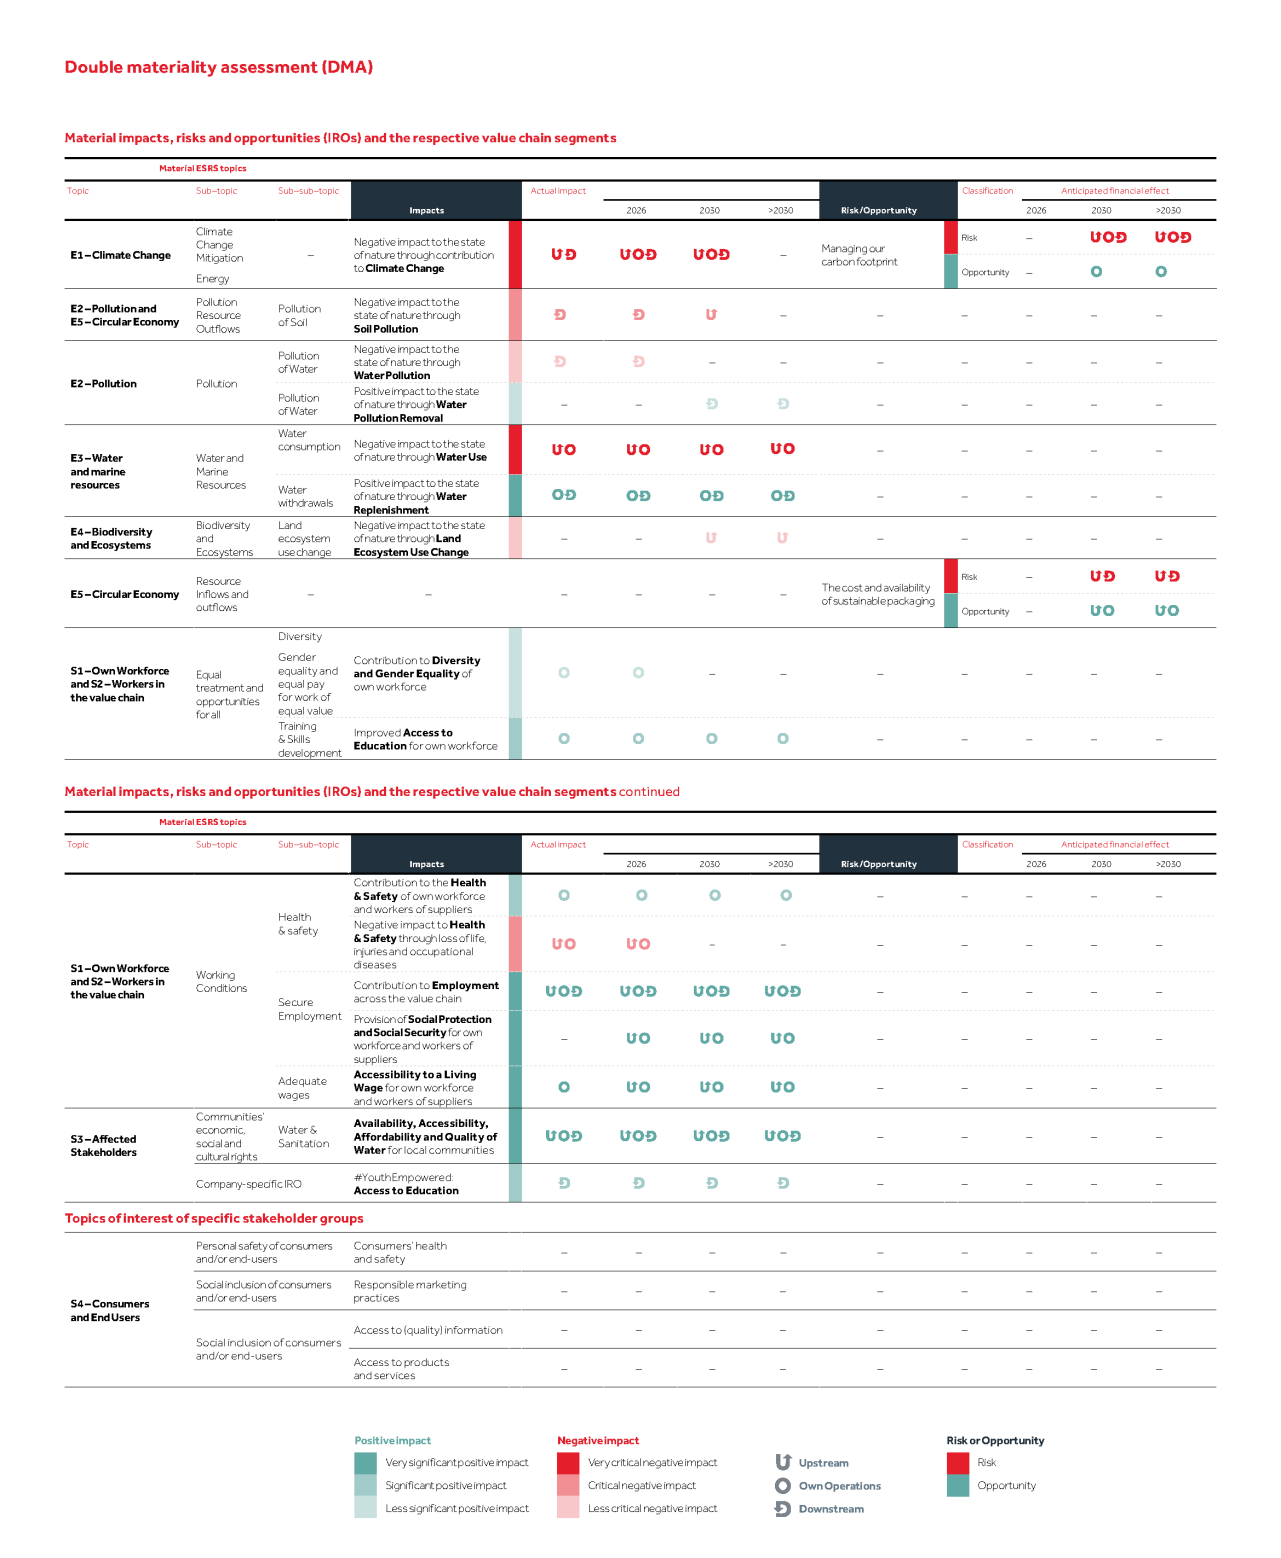
Impact materiality
We evaluated both the positive and negative effects on nature and people, considering the actual and potential impacts for 2025 across three distinct timeframes (short term – 2026, medium term – 2030, and long term – 2030+). Each segment of our value chain (upstream, own operations, and downstream) was analysed independently.
We examined the severity of negative impacts and the significance of positive impacts, as well as the likelihood and severity of potential impacts.
Quantitative thresholds were assigned values from 1 to 5, with 1 representing low severity/ significance/likelihood and 5 denoting high severity/significance/likelihood. By applying a specific calculation, we established a five-tier rating scale for each impact: critical, major, moderate, minor and insignificant. ‘Major’ and ‘critical’ impacts are deemed material.
Stakeholder involvement
We assess our impacts on people and the environment as part of our daily activities, engaging with relevant stakeholders and experts, and considering emerging sustainability trends.
During the DMA, we gathered insights from internal experts across multiple functions. When planning ESRS/DMA-specific activities, we consider Coca-Cola HBC’s engagement with stakeholders and our due diligence processes.
After interviews with 26 external subject matter experts and impacted stakeholders in 2024, we engaged with external stakeholders through surveys in 2025 to validate the results of the impact materiality exercise. Surveys were distributed to 40 stakeholders representing diverse groups, including national and local NGOs, industry associations, customers, suppliers, investors, community participants, sustainability rating agencies and internal stakeholders with sustainability roles. Our focus was on validating the list of actual (current) and potential impacts – both positive and negative – on the environment and on people.
Survey results confirmed the relevanceof our identified material impact and guided our disclosures in line with the expectations of Sustainability Statement users.
Financial materiality
For the identification of risks and opportunities (ROs) across principal and emerging risk categories, we drew on our risk universe and our Business Resilience Framework. We also identified ROs arising from both negative and positive impacts, and value chain dependencies, using external tools such as Encore11.
We mapped each RO to the appropriate stage of our value chain – upstream, own operations or downstream – and assessed its likelihood of occurrence for the three relevant time horizons (short term – 2026, medium term – 2030, and long term – 2030+). We also linked each RO to the corresponding ESRS topics and sub-topics.
For the final assessment of the ROs, we evaluated both their likelihood of occurrence and the magnitude of their potential financial effects on Coca-Cola HBC. Depending on data availability, we assessed – either quantitatively or qualitatively – the financial effects on our financial position, financial performance, cash flows, cost of capital and access to finance. Where feasible, we used the percentage of comparable EBIT as a quantitative indicator of magnitude.
Finally, we prioritised ROs based on their inherent risk level, determined by combining their financial magnitude and likelihood. Our inherent risk heatmap uses a 1-5 scale, similar to the one used for impact materiality. Using an above-average threshold, all ROs classified as ‘high’ or ‘critical’ are deemed material.
Double materiality approval
The result of the DMA depicts impact materiality and financial materiality across each value chain step and time horizon. DMA result is reviewed and approved by CCHBC management, including members of the ELT. It is subsequently endorsed by the Board’s Social Responsibility Committee and the Audit and Risk Committee. In addition, the result is subject to independent third-party assurance.